Machine Learning and ML Model?
ML is the process of training a ML Model, to make useful predictions or generate content (like text, images, audio, or video) from data.
Types of Machine Learning
| Supervised Learning | Unsupervised Learning | Semisupervised Learning | Reinforcement learning | Generative AI | |
|---|---|---|---|---|---|
| What |
Training data feed to the algorithm includes the desired
solutions(called labels). Example: This is like a student learning new material by studying old exams that contain both questions and answers |
Dataset does not have labels. ML model tries to learn without teacher. ML has to estimate whether it's correct/incorrect and create its own rules |
lot of unlabeled data and a little bit of labeled data. Examples: 1. FB Photos: When we load photos, we provide labels to few and leave others. AI identifies photos. |
Agent(AI Program) can observe the environment, select and perform
actions, and get rewards or penalties based on actions performed
within an environment Example: used to train robots to perform tasks, like walking around a room |
Models that creates content from user input. Eg: Create unique images, music compositions, jokes, Text-to-text Text-to-image Text-to-video Text-to-code Text-to-speech Image and text-to-image |
| Types |
|- Regression
  |- Linear
  |- Logistic(Sigmoid)
  |- Decision Trees
    |- Random Forest
|
1. Clustering: 2. Visualization and dimensionality reduction With unlabelled data this algorithm provides ouput which can be plotted on 2-D, 3-D plane. Algorithms used: Principal Component Analysis (PCA) Kernel PCA Locally-Linear Embedding (LLE) t-distributed Stochastic Neighbor Embedding (t-SNE) 3. Association rule learning: This provides output as relations between attributes. Algorithms used: Apriori Eclat |
|||
| Algorithms |
Clustering: k-Means, Hierarchical Cluster Analysis (HCA),
Expectation Maximization Visualization and dimensionality reduction: Principal Component Analysis (PCA), Kernel PCA, Locally-Linear Embedding (LLE), t-distributed Stochastic Neighbor Embedding (t-SNE) Association rule learning: Apriori, Eclat |
Deep belief networks (DBNs) |
1. Supervised Learning Models
Algorithms: k-Nearest Neighbors, Linear Regression, Logistic Regression, Support Vector Machines (SVMs), Decision Trees & Random Forests, Neural networks
1.1 Regression (Gives % or numeric value)
Examples: Predict whether based on inputs, Predict price of car provided
with some inputs(mileage, age, brand, etc.)Decision Tree Regressor
Logistic Regression: Mix of classfication & Regression. Example: 20% of
chances being a spam.
1.1.1 Linear Regression = Linear Equation
linear regression finds the relationship between
features(Given value
= x) and a label(To be
predicted value = y), ie finding the best-fit line
Linear equation in n variables is called 1 Neuron
Understand linear equation in Mathematics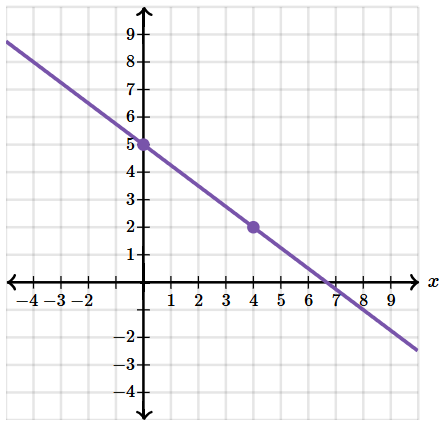 |
In Machine Learning(Model with 1 feature(x))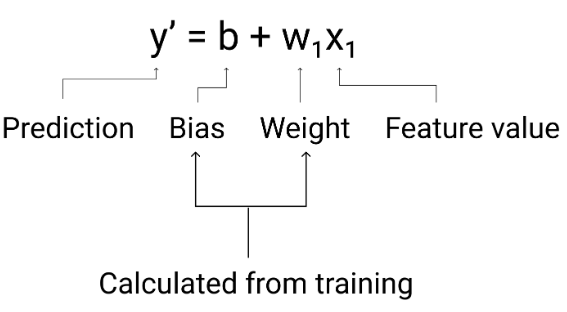
|
In Machine Learning(Model with many features)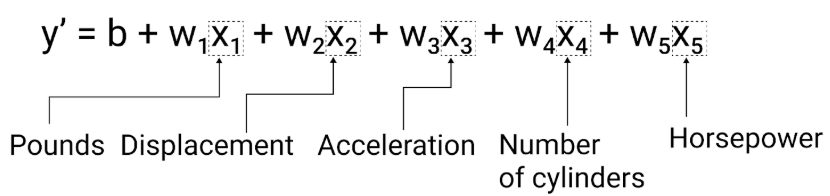
|
Loss in linear regression
Purpose of linear regression: Create the Line
You are given many (x, y) points, but you do NOT know the line, we need
to create the line, so that in future if we provide x(feature) value we
get y(label) prediction output
Example: Suppose House prices are given, but we donot know the equation.
In future when some house size would be given we want to calculate
price, that means we should know the equation. In order to know the
equation we should know slope, gradient desent
| Size (x)  | Price (y) |
| --------- | --------- |
| 1000 sqft | 2 Cr      |   (1000,2)
| 1200 sqft | 2.4 Cr    |   (1200,2.4)
| 1500 sqft | 3 Cr      |   (1500,3)
| 1800 sqft | 3.6 Cr    |   (1800,3.6)

Prediction from Model: if x=1700, y=?
Gradient Desent
This is the technique to find weight(w), bias(b) iteratively with the
lowest loss, and finally creating the linear equation.
Steps of Gradient Decent
w = 0.1, b = 50     // 1. Start with random values of w,b.
y = .1x + 50
y = .1x1000+50=150  // Put x=1000, y=150.
  loss = y-actual_value
  if (loss > 5) { // Suppose
    // Determine the direction to move the weights and bias that reduce loss.
    // Repeat
  }
Types of Gradient Desent
1. Vanishing Gradients: During
backpropagation, the gradients become extremely
small, so the earlier layers of the
neural network learn extremely slowly or almost
stop learning. When the gradient values approach 0 for the lower layers,
the gradients are said to "vanish". The ReLU activation function can
help prevent vanishing gradients.
2. Exploding Gradients: During
backpropagation, the gradients become extremely
large. Batch normalization can help prevent exploding gradients
Hyperparameters
These are variables that control different aspects of training.
So m,b are parameters which need to be calculated during training, but
hyperparameters define how m,b are derived
1. Learning rate: This determines magnitude of the changes to
make to the weights and bias during each step of the gradient descent
process for model to converge quickly. For example, if the gradient's
magnitude is 2.5 and the learning rate is 0.01, then the model will
change the parameter by 0.025.
If the learning rate is too low, the model can take a long time
to converge.
if the learning rate is too high, the model never converges, but
bounces around the weights and bias that minimize the loss. Pick
a learning rate that's not too high nor too low so that the model
converges quickly.
2. Batch size: number of examples the model processes before
updating its weights and bias
a. Stochastic gradient descent(SGD): Uses single example
(a batch size of one) per iteration to adjust m, b.
b. Mini-batch stochastic gradient descent(mini-batch SGD):
Compromise between full-batch and SGD.
3. Epochs
1.1.2 Logistic Regression = Sigmoid function (Find Probability)
Sigmoid/S Shaped Function
|
Value of function will always remain between 0 and 1, making it good
fit for probability e = 2.718(Euler's number) 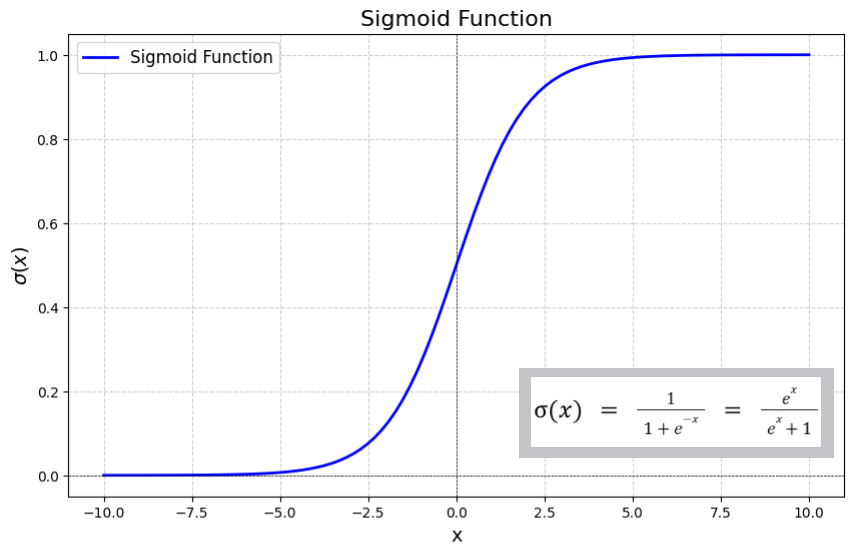
|
Sigmoid translates linear regression to a probability Example: Given number of hours student studied, can model predict if student can pass? Other Examples: - Predict whether mail is spam or not Loss in Sigmoid is Log Loss |
1.1.3 Decision Tree / Piecewise / Step Function / Regression Tree
Constant value of y(label) for range of some x(feature) values.
|
There are regions of x(feature), for which y(label) has constant
value.
|
Random Forest Decision Tree Regression
Summation of several decision trees. Suppose we have 3 decision trees:
T1(x), T2(x), T3(x).Each tree gives its
own prediction.
T1(5) = 8
T2(5) = 10
T3(5) = 12
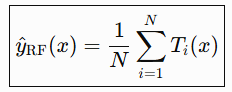
yRF(5) = (T1(5) + T2(5) +
T3(5)) / 3 = 10. // The random forest takes their average
Random Forest equation
Ti(x) is 1 decision Tree
1.2 Classification (Gives yes/no or enums)
Example: predict if an email is spam or if a photo contains a cat
1.2.1 Binary classification (true or false)
models output a value from a class that contains only two values, for example, a model that outputs either rain or no rain
1.2.2 Multiclass classification (enums)
models output a value from a class that contains more than two values, for example, a model that can output either rain, hail, snow, or sleet.
1.1.2 Decision Tree
-
This is Binary Tree(not balanced) which works in flowchart-like manner
where each internal node represents a "test" on an attribute, each
branch represents the outcome of the test, and each leaf node represents
numerical value (ie Prediction).
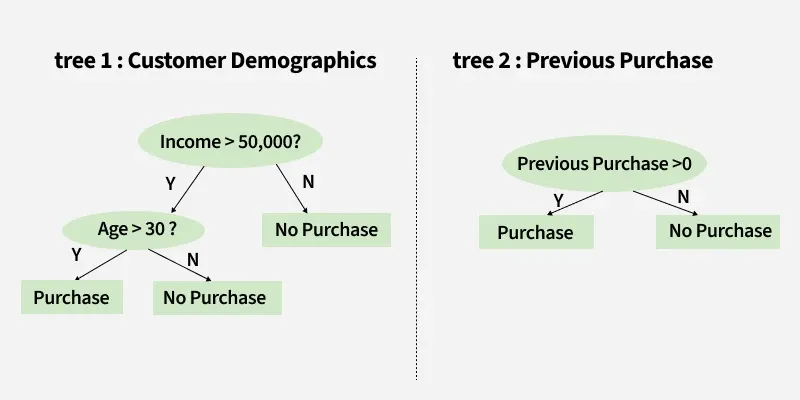
How it works? Predicting Whether a Customer Will Buy a Product Using Two Decision Trees
|
If Tree 1 predicts "Purchase" and Tree 2 predicts "No Purchase", the final prediction might be "Purchase" or "No Purchase" depending on the weight or confidence assigned to each tree. |
Information Gain tells us how useful a question (or feature) is for splitting data into groups
It measures how much the uncertainty decreases after the split.
For example if we split a dataset of people into "Young" and "Old" based on age and all young people bought the product while all old people did not, the Information Gain would be high
Gini Index in Decision Tree: Metric to measure how often a randomly chosen element would be incorrectly identified. Lower Gini index represents a better split
Fitting
Overfitting in Decision Tree
when tree has too many splits becomes too deep, and it makes very good predictions to training data, but does poor predictions on new data.
As the tree gets deeper, the dataset gets sliced up into leaves with fewer choices. we'll have 210 groups by the time we get to the 10th level. That's 1024 leaves.
When we divide the tree in too many leaves, we also have fewer data in each leaf. Very few Leaves will make predictions that are quite close to actual values, but they may make very unreliable predictions for new data (because each prediction is based on only a few input samples).
Underfitting in Decision Tree
On otherside, if only few splits are performed(only 2 or 4), Resulting predictions may be far off for most input samples, even in the training data.
When a model fails to capture important distinctions and patterns in the data, & perform poorly even in training data, poorly in new data is underfitting
Overfitting or underfitting(What's preferred)? We need to hit a sweet spot between 2
1.1.2 Random Forest
-
Problems with Decision Tree:
Overfitting(Deep tree with lot of leaves) or underfitting(very
less depth) Random forest solves it
What is Random Forest?
Random forest uses lot of decision trees & make prediction by averaging each of Component trees.
Has much better predictive accuracy than a single decision tree & works well with default params
2. Unsupervised Learning
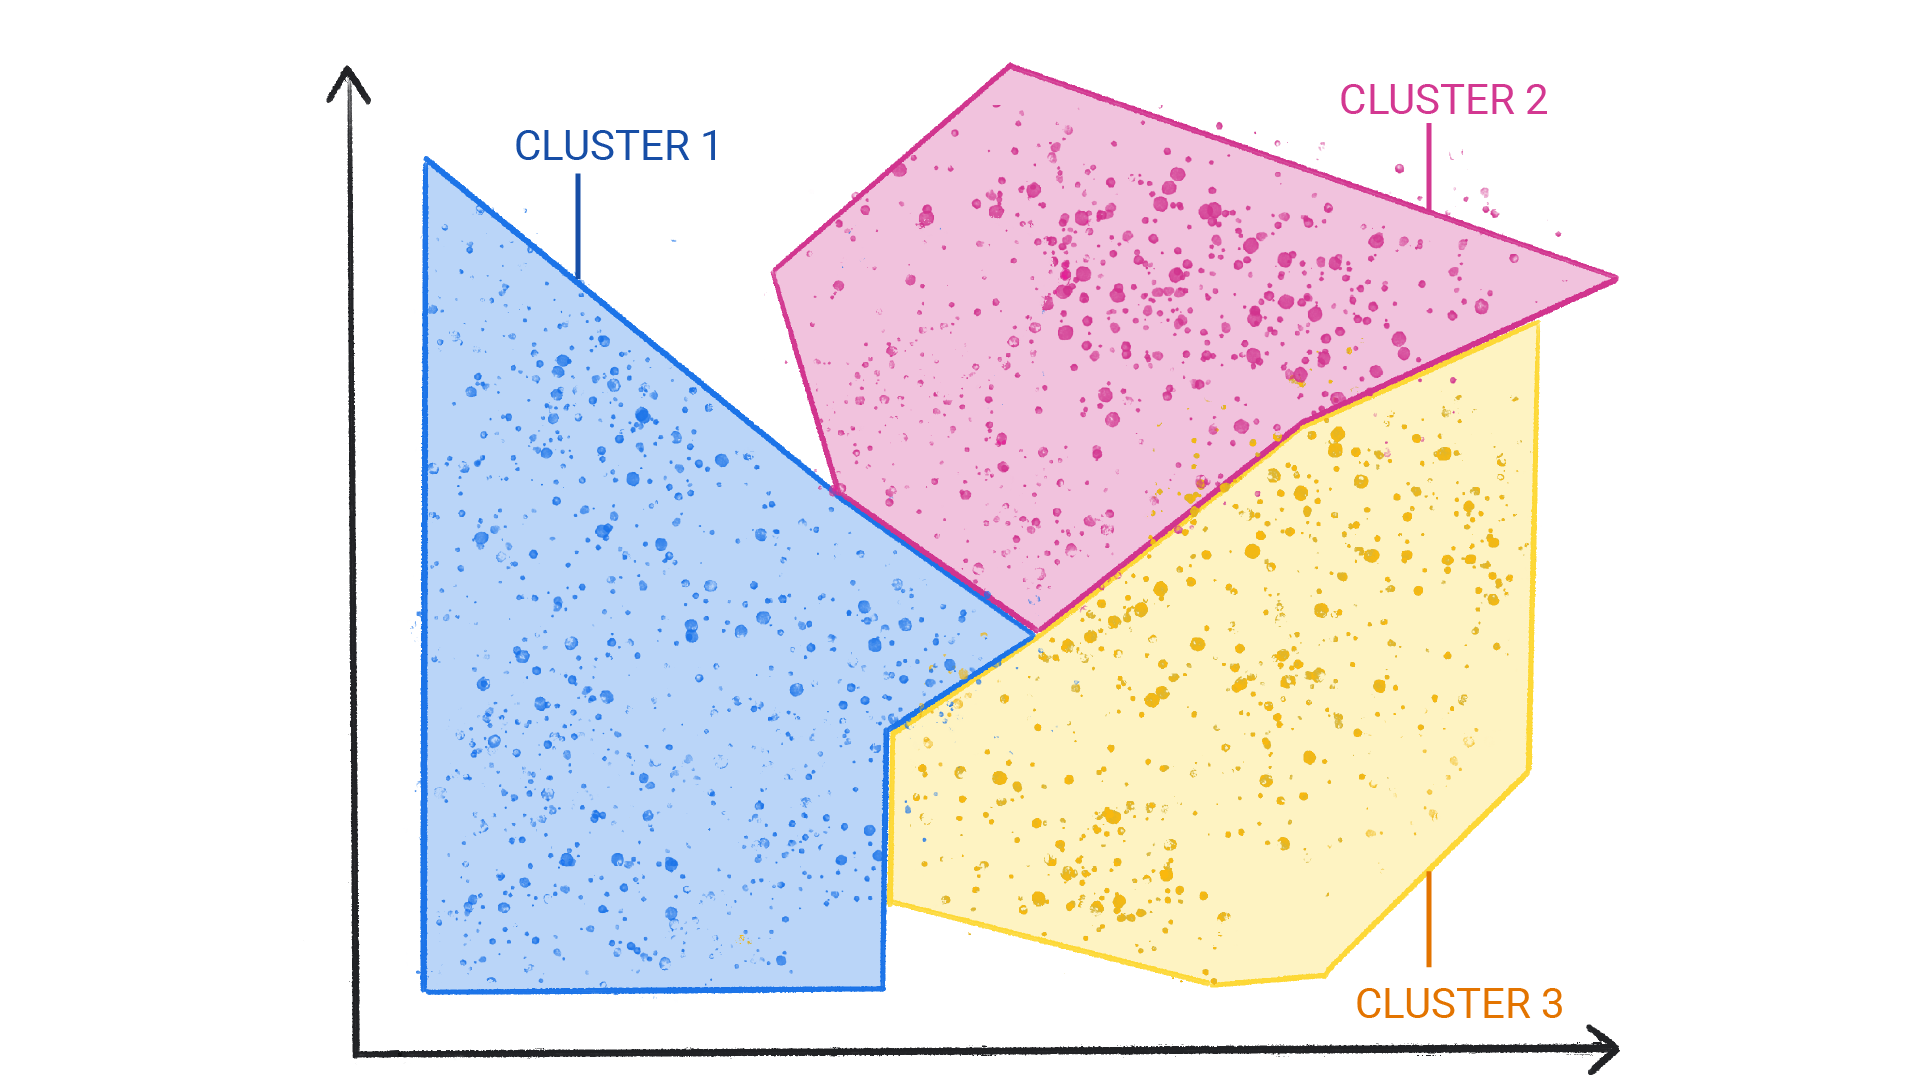
2.1 Clustering
Clustering differs from classification because the categories aren't
defined by you. For example, an unsupervised model might cluster a
weather dataset based on temperature.
Algorithms used: k-Means, Hierarchical Cluster Analysis (HCA),
Expectation Maximization
|
Algorithms
1. KNN (K Nearest Neighbors). O(n)
Keyword search & Semantic Search
is KNN algorithm for
RAG pipeline's
retriver. But KNN works in O(n) Complexity, ie it finds User's query
embedding with 1:1 comparsion with log entries embeddings & will not
scale if there are 1 billion entries. In this case we need to compare
user query's embedding with all 1 billion log entries embedding.
And everytime there will be Billion comparisons.
Hence production retrievers use ANN
2. ANN(Approximate Nearest Neighbours)
ANN does not gurantee to find closest document to the query string, but can find very close by.
2.1 Navigable Small World (NSW)
|
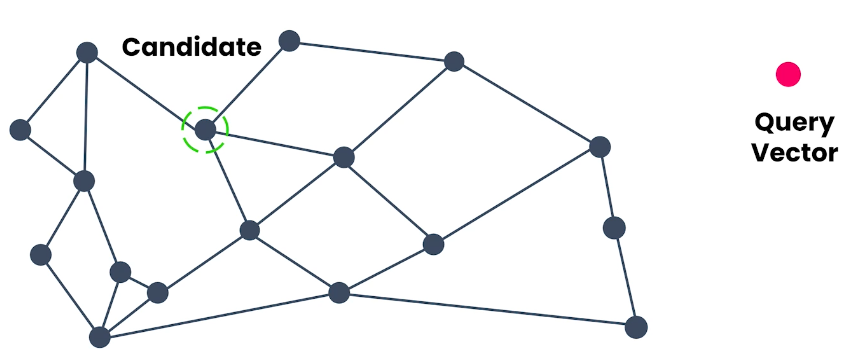
How it works? - Every document is represented by a embedding in embedding space - It creates a GRAPH called PROXIMITY GRAPH, where every document's embedding is placed as 1 node - Every node in graph is connected to its nearest neighbour - When a user's query is received it embedding is calculated - A RANDOM candidate node(on proximity graph) is choosen, now algorithm looks at closest neighbours of candidate node and find closesness to user's query embedding and finds which of them is closest to prompt vector - Since there are very few neighbours to choose from, whichever is closest becomes the new candidate. Now process repeats for the new candidate - Process continues until none of neighbours is closest to the current candidate and candidate vector is returned. - With small modification this approach can return multiple closest vectors - Proximity graph can be computed before recieving any user prompt |
2.2 Hierarchial Navigable Small World (HNSW). O(logn)
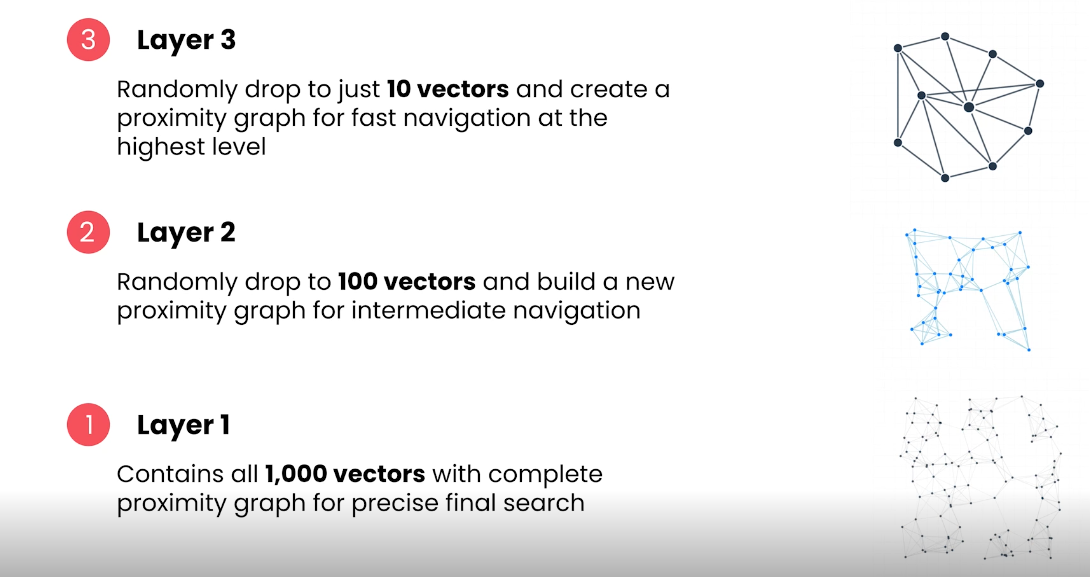
|
How it works? - It creates Hierarchail proximity graphs - Layer-1 Proximity Graph: Contains all nodes on graph as created in Navigable Small World - Layer-2 Proximity Graph: Randomly drop to only 100 vectors and build proximity graph for intermidiate navigation - Layer-3 Proximity Graph: Randomly drop to just 10 vectors and build proximity graph - Search begins in Layer-3. Algorithm chooses a RANDOM candidate in layer-3 graph and find searches closest to prompt(user query) vector - Search goes to Layer-2 and finds best candidates in layer 2 - Search goes to Layer-3 and finds best candidates in layer 3 - HNSW is very fast wrt KNN |
Encoders
1. Bi-Encoder
In Information Retrieval and Neural Search architectures, bi-encoders
and Approximate Nearest Neighbor (ANN) search are two complementary
things
Bi-encoders generate the document vector embeddings and then seperately
prompt embeddings and compare for nearest items.
Prompt                    Documents
  \/                        \/
|-----------------|   |-----------------|
| Embedding Model |   | Embedding Model |
|-----------------|   |-----------------|
  \/                        \/
[0,5,0,2,1,3]         [1,4,1,5,7,9,9]
  \/                        \/
|-------------------------------------|
|            Bi-Encoder               |
| vector DB uses ANN to search/compare|
| prompt and document vectors         |
|-------------------------------------|
2. Cross-Encoder
Cross Encoder always provides better search results wrt Bi-Encoder, but
it takes a bit of more time
How it work: Prompt is prepended to each Document before
(Prompt+Document) is fed to special embedding model. Embedding model
generates a relevancy score. Highest relevant score is taken as closest
document(s).
Advantage:
1. Quality of results is great and they can be used to improve
results of other search techniques
Disadvantage:
1. if there are billions of documents, there will be O(n)
complexity as every document need to be passed with prompt to embedding
model.
2. Preprocessing(ie calculating the embeddings in advance before
recieving the prompt) cannot be done, which can be done in Bi-Encoder
Prompt    +     Document
    \/              \/
|---------------------------|
|       Cross Encoder       |
|---------------------------|
            \/
      Relevancy Score(70%)
3. ColBERT(Contexualized Late Interaction over BERT)
Instead of generating 1
embedding vector for whole
document(as in Cross-Encoder), ColBERT generate 1 embedding vector for 1
token
This process is carried for every document and also for prompt.
And then Each prompt vector is searched for most similar document
vector
Advatanges:
1. Provides scalability of Bi-encoder and high matching results
of cross-encoder
2. Faster than cross-encoder and can be used in real time
searches
Disadvatanges:
1. Number of vectors to be stored is very high wrt any other
method
Document
    \/
|--------------------|
| Embedding Model    |
|--------------------|
    \/
    [1,2,4,6,9,2]   //Token1    // All Document vectors
      [7,2,4,8,3,6] //Token2
        [9,5,1,4,5,9] //Token3
          [3,4,1,6,3,1] //Token4

  Prompt
    \/
|--------------------|
| Embedding Model    |
|--------------------|
    \/
    [3,4,6,0,1,4]   //Token1    // All Prompt vectors
      [5,6,9,3,1,3] //Token2

Compare All Document vectors, All prompt vectors to find nearest similar vectors
4. Reranking
Technique where Bi-encoder and cross-encoder are used in pipeline.
X Nearest documents are found to query vector using Bi-encoder
Then these X documents are fed to cross-encoder which further returns
closest documents to the query.
if 1 billion documents are fed to Bi-encoder, 50-100 documents are
outputted by Bi-encoder, which are fed to Cross-Encoder, which further
finds nearest documents to Query. Cross-Encoder will return 10-15
documents.
STEP 1:
Document Embeddings
[1,2,4,6,9,2]
[7,2,4,8,3,6]
[9,5,1,4,5,9]
[3,4,1,6,3,1]
.. 1 Billion

Prompt Embedding
[3,4,6,0,1,4]

      Documents > |------------|
      Prompt    > | Bi Encoder | > 100 Nearst Documents
                  |------------|

STEP-2:
Prompt + Document
      \/
|---------------|
| Cross Encoder |
|---------------|
      \/
      10 very near Documents