Artificial Intelligence vs Machine Learning vs Deep Learning
| AL | ML | Deep Learning | |
|---|---|---|---|
| Originated | 1950 | 1960 | 1970 |
| What | Simulated Intelligence in Machines | Machine making decisions without being programmed | Using Neural networks to solve complex problems |
| Objective | Building machines which can think like humans | Algo which can learn thru data | Neural n/w to identify patterns |
Activation Function
Activation function is applied on output of a Layer. It makes the layer
behave as sigmoid(for
binary classification), softmax(for multi-class classification), no
activation(for
linear regression).
Usage of Activation Function (To represent Non-Linear
relationships):
Neural network is composed of neurons on layer. Neurons are
linear equations, whose output is also linear equation. when linear
equation is fed to Activation Function, we can achieve non linear
relationship based on shape of activation function
With enough layers and activation function in neural network we
can approximate any non linear function via neural network.
model = keras.Sequential([
  layers.Dense(1),                        # Linear Regression. /Machine%20Learning/ML_and_Types_Algorithms.html
  layers.Dense(1, activation="sigmoid"),  # Sigmoid Function. Logistic Regression. /Machine%20Learning/ML_and_Types_Algorithms.html
  layers.Dense(64, activation="relu"),    # ReLU (Rectified Linear Unit). if(x<0)return 0. if(x>0)return input value
  layers.Dense(32, activation="softmax"),    # Converts a vector of raw scores into probabilities that sum up to 1.
  layers.Dense(32, activation="tanh"),    # F(x) = tanh(x)
  layers.Dense(.., activation="other"),   # In practice, any mathematical function can serve as an activation function
])
Agent
What?
Agent is a program that uses an LLM to decide
what to do next.
It is installed on User's Laptop and makes decision using (Think
> Observe > Repeat) loop until it reaches the final answer for
question asked by user.
Example(Claude, Cursor Agent):
When you install Cursor IDE and run on Windows, Cursor agent runs
as Windows Service
Open Cursor > Ctrl + Shift + P > Developer: Open Process
Explorer > Tree of cursor processes (extensionHost: This is local AI
agent)
|
Agent installed on laptop User Edit C++ file on Cursor IDE Test, Commit changes |
No Agent Installed on laptop chatgpt in browser |
|---|---|
Cursor Agent is installed with IDE on laptop
sequenceDiagram
autonumber
actor User as Developer
box User Device / Laptop
participant LocalAgent@{ "type" : "control" } as Cursor IDE
|
sequenceDiagram
autonumber
actor User as User
box User Laptop
participant UI as ChatGPT
|
AutoML
This is a process of automating certain repetitive tasks in a machine
learning workflow. eg: Data Engineering(Feature engineering, Feature
selection), Training(Identifying an appropriate ML algorithm, Selecting
the best hyperparameters), Analysis(Evaluating metrics generated during
training)
Benefits of AutoML
1. To save time: save time by avoiding extensive manual experimentation
to find the best model.
2. Build an ML model without needing specialized skills
3. Best practices: Automation includes built-in support to apply ML best
practices
Limitations
1. Model quality may not be as good as manual training
2.
Axis
Pandas
In Pandas Dataframe: axis can
have 2 values only:
0=index The vertical axis. Operations move down the rows.
1=columns The horizontal axis. Operations move across the
columns.
Backpropagation (How each weight should change)
Backpropagation for neural network is way
to learn from its mistakes.
Remember neural network is neurons = weight x feature. In
Linear regression we are
given y,x but we need to find w,b ie find weights.
if neural network does wrong prediction, error is sent backward to
adjust weights to make correct predictions
Make a prediction → calculate how wrong it is → send that error
          backward → adjust the weights → try again
If the prediction is wrong, backpropagation calculates: How much did
each weight contribute to the error?
Then an optimization algorithm such as
gradient descent changes the
weights:
Weight_new = Weight_old - learning_rate × gradient
Example to understand backpropagation:
Correct equation to be predicted is y=2x+1. if x=2, y=5
But model predicted w=3(instead of 2). y=3x+1. On x=2, y=7
so there is a drift of 7-5=2

Loss = square(2)=4. Because loss can be negative as well. To take +ve loss all time.

gradient desent. w(new) = w(old) - learning_rate x loss
                        = 3 - .1x4 = 2.6
Bias
Bias in ML refers to systematic errors or prejudices in a model's
predictions that lead to unfair outcomes for certain groups of people.
This is corrected using Fairness
Bias usually stems from historical human prejudices embedded in the
training data rather than the code itself.
Mitigating the Bias
1. Augmenting the training data: If an audit of the training data has
uncovered issues with missing, incorrect, or skewed data, the most
straightforward way to address the problem is often to collect
additional data.
2. Adjusting the model's loss function: we can choose an optimization
function designed to penalize errors in a fairness-aware fashion
Types of Bias:
Historical Bias
Over the past decade, the company predominantly hired men for
engineering roles. The AI analyzes this data and "learns" that being
male is a key feature of a successful employee. Consequently, it starts
downgrading resumes from equally or more qualified female applicants
because their profiles don't match the historical pattern. The model has
internalized historical data bias
Fairness to Correct it: To make the system fair, data scientists
intervene. They might strip out identifying markers like names and
gendered language from the resumes, or apply mathematical constraints to
ensure the model evaluates candidates purely on technical skills,
ensuring that a qualified woman has an equal probability of being
shortlisted as a qualified man.
Sampling Bias
The training data does not accurately represent the real-world population (e.g., testing a facial recognition system primarily on lighter skin tones, causing it to fail on darker skin tones).
Measurement Bias
Choosing flawed metrics to define success (e.g., using "amount of money spent on healthcare" as a proxy for "healthcare need," which ignores individuals who cannot afford care in the first place).
Cartesian Product
Cartesian product (A x B) is the set of all possible combinations. Eg:
Set A (Shirts): {Red, Blue}
Set B (Pants): {Jeans, Cargo}
Cartesian product (AXB) = (Red, Jeans), (Red, Cargo), (Blue, Jeans), (Blue, Cargo)
Categorical Data (enums)
Data having a specific set of possible values. For example: different species of animals in a national park, names of countries etc.
Preparing the Categorical Data
Preparing means converting categorical data into numerical format so
that it can be used in ML models. There are 3 ways to prepare
categorical data:
1. Drop Categorical Data: If categorical data is not important for
model, we can drop it.
2. Ordinal/Label Encoding: Assigning each category a unique integer
value.
Red = 4
Blue = 0
Green = 1
3. One-Hot Encoding: Creating binary columns for each category, where the presence of a category is marked with a 1 and absence with a 0.
Color   Red   Blue  Green
Red     1     0      0
Blue    0     1      0
Green   0     0      1
Conda
Miniconda
is the recommended approach for installing TensorFlow with GPU support
It creates a separate environment to avoid changing any installed
software in your system. This is also the easiest way to install the
required software especially for the GPU setup.
Confusion Matrix
Model's work is to detect cancer. Positive result would be considered when model correctly detects cancer
Example: Cancer Detection
Suppose there are 100 people.
- 20 actually have cancer. 80 do not have cancer.

The AI predicts (Confusion Matrix):
Actual	      Predicted Cancer	Predicted Healthy
Cancer(20)	      18	            2             // out of 20
Healthy(80)	      10	            70            // out of 80

--------------------100 Patients--------------------------------------
=====20 cancer=====|==================80 Healthy======================
..18cancer....2no..|....10cancer....,............70healthy............
  TP          FN         FP                       TN
| Term | Meaning | Example |
|---|---|---|
| True Positive (TP) | Model said Cancer, actually Cancer | 18 |
| True Negative (TN) | Model said Healthy, actually Healthy | 70 |
| False Positive (FP) | Model said Cancer, actually Healthy | 10 |
| False Negative (FN) | Model said Healthy, actually Cancer | 2 |
Recall, Precision, Accuracy, False Positive Rate
| Metric | Formula | Description |
|---|---|---|
| Accuracy |
(TP + TN) / (TP + TN + FP + FN)
|
Out of all predictions, how many were correct? |
| Recall (Sensitivity / True Positive Rate) |
TP / (TP + FN)
|
Out of all actual positives, how many did I detect? |
| Precision @ K |
K = Number of nearest documents we want to retrieve to User's Query
embeddingsPrecision = TP / (TP + FP)
|
Suppose there is a RAG pipeline for answering user's firewall log
Queries. We input 1 million log files to RAG pipeline. We wanted top
100 nearest log files to User's query embedding. (k=100) RAG retriever returned 100 documents mentioning the nearest to User's query (using cosine similarity). When we compared these 100 documents to ground truth(ie Actual logs referring User's query), we found only 40 are Truly near to User's Query embedding, that means TP=40. While 60 are not near to User's query embeddings but falsly provided by retriever(ie 60 is False positive). Code Hence Precision = 40 / (40+60) |
| False Positive Rate (FPR) |
FP / (FP + TN)
|
Out of all actual negatives, how many did I wrongly classify as positive? |
One-Line Memory Tricks
| Metric | Remember It As... |
|---|---|
| Accuracy | How often am I correct overall? |
| Recall | Did I catch all the real positives? |
| Precision | When I predict Positive, am I usually right? |
| False Positive Rate | How often do I raise a false alarm? |
Context
Context is helpful information before or after the target token. Eg:
I went to the bank.

Bank can mean = financial institution or River Bank

The words around bank give us context(ie correct meaning of word).
Dataset
Datasets are made up of individual entries that contain features and a
label. Example: Xcel sheet having data is a dataset
Diversity indicates the range those examples cover. Good datasets
are both large and highly diverse. Datasets can be large and diverse, or
large but not diverse, or small but highly diverse. In other words, a
large dataset doesn't guarantee sufficient diversity, and a dataset that
is highly diverse doesn't guarantee sufficient examples.
Labelled Dataset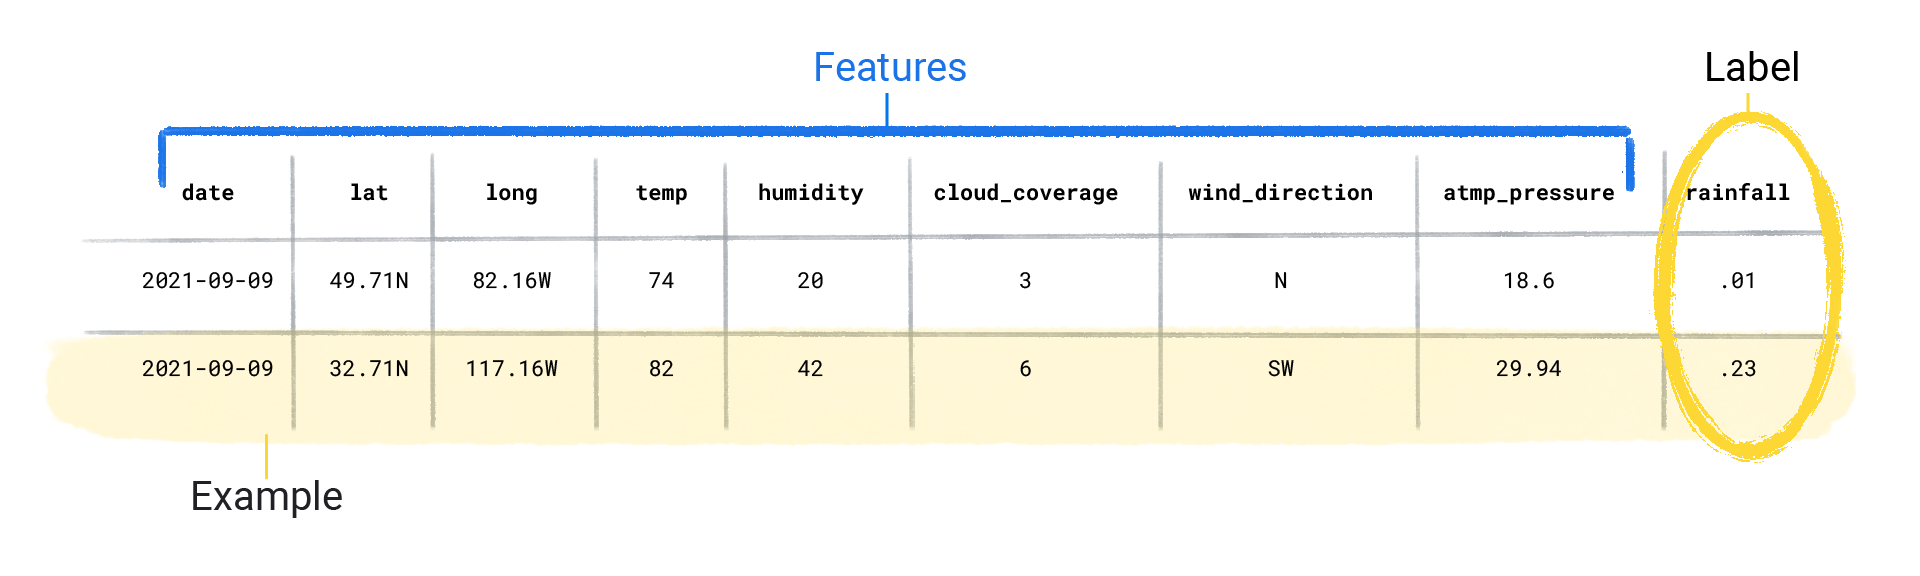
|
Unabelled Dataset: contain features, but no label. After you create
a model, the model predicts the label from the features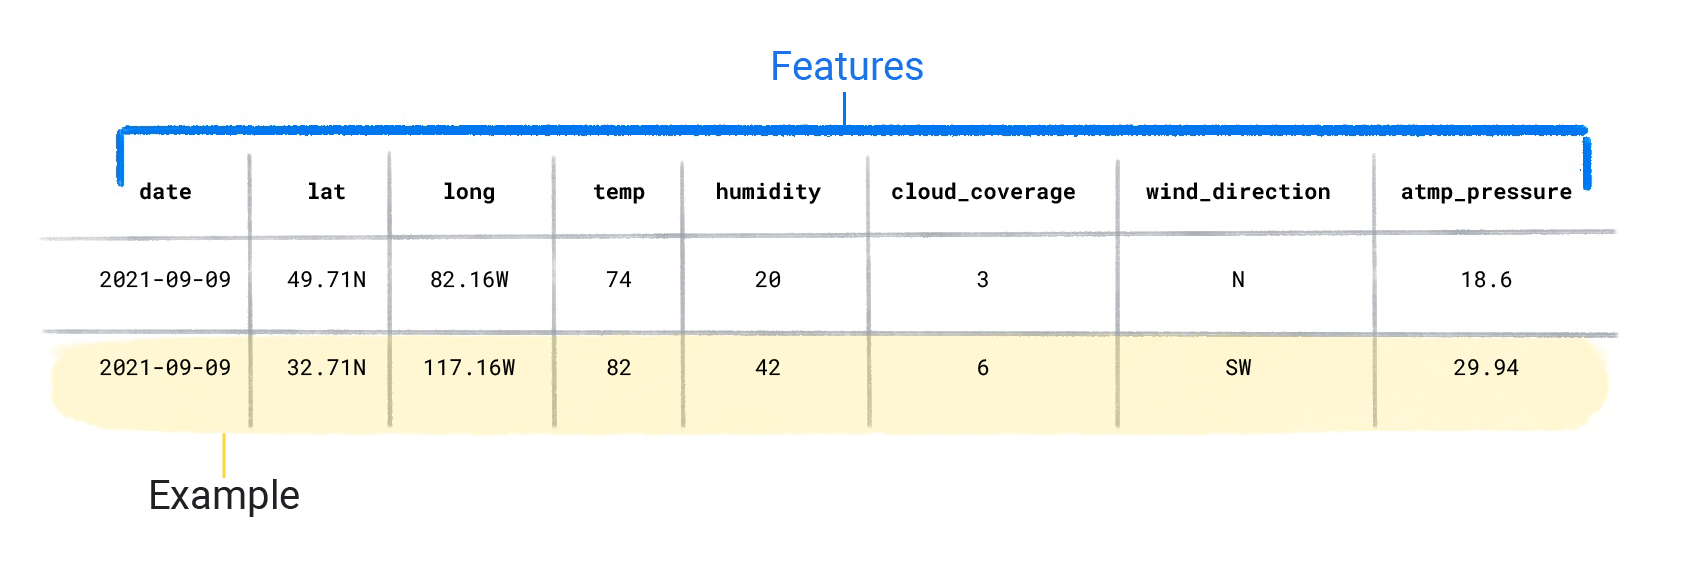
|
Types of Dataset
Numerical data
Categorical Data
human language, including individual words and sentences
multimedia (such as images, videos, and audio files)
Outputs from other ML systems
Embedding vectors
Class-balanced: number of positive classes and negative classes is about
equal.
Class-imbalanced: one label is considerably more common than the other.
In the real world, class-imbalanced datasets are far more common than
class-balanced datasets.
Stationary dataset is a time series where statistical properties like
the mean, variance, and autocorrelation stay constant over time.
Dividing the Dataset
Dataset should be divided into 3 parts
1. Training set: Set on which model is trained.
2. validation set: Set against which trained model should be
validated
3. Test set: Once model is trained, it should be tested against
this set.
Optimizer
Optimizer minimizes Gradient Descent to minimize the Loss
| Optimizer | Meaning | Example |
|---|---|---|
| 1. RMSprop (Root Mean Square Propagation) | It divides the learning rate for a weight by a running average of the magnitudes |
|
| 2. Stochastic Gradient Descent (SGD) | updates the parameters by taking a fixed step size (the learning rate) |
|
| 3. SGD with momentum | To fix the oscillation problem of standard SGD, Momentum adds a velocity term ($v$) |
|
| 4. "adam" (Adaptive Moment Estimation) | Adam combines the principles of Momentum (tracking the mean of the gradients, or first moment mt) |
|
Orchestration
Monitoring and handling ML pipelines
Steps in Orchestration?
1. Workflow Definition: Defining the sequence of steps (tasks)
2. Automation: Automatically triggering and running the
pipeline
3. Resource Management: managing the underlying computational
resources (CPUs, GPUs)
4. Monitoring and Logging: Tracking the execution status,
performance metrics
Outlier
Most feature values in a
dataset typically fall within a range.
An outlier is a value distant from most other values in a feature or
label. Outliers often cause problems in model training, so finding
outliers is important.
For example, cars are normally between 2000 - 5000 kg. But a car of
15000 kg is an outlier.
Finding Outliers
1. Percentile
When the delta between the 0th and 25th percentiles differs
significantly from the delta between the 75th and 100th percentiles, the
dataset probably contains outliers.
Consider a class of students, My Percentile means number of students
below my marks in class
Consider there are 4 students with marks 10, 20, 50, and 90
For the student who got 10 marks:Percentile: 25%, Why: There is 1
student out of 4 who got 10 or lower (1/4 = 25%).
For the student who got 20 marks:Percentile: 50%, Why: There is 2
student out of 4 who got 20 or lower (2/4 = 50%)
CNTK
This is Microsoft Cognitive Toolkit (CNTK) backend, plugged with keras.
Embedding / Vector Embedding
Embedding = one point/vector.
Suppose we have 4 foods and we want to represent foods on basis of
"fast-food-ness", "sweetness".
Food	      "fast-food-ness"       "sweetness"
Pizza        0.9                    0.1            //[0.9, 0.1] < These 2 numbers are called embeddings(high-dimensional numerical vector)
Burger       0.95                   0.05
Salad        0.1                    0.0
Ice cream    0.2                    0.95
Embeddings aren't limited to words. Images, audio, and other data can
also be embedded
Use of Embeddings?
More close 2 embeddings are, more similar items are.
Pizza → [0.9, 0.1], Burger → [0.95, 0.05] These
points are very close. Hence: Pizza ≈ Burger
Pizza → [0.9, 0.1], Ice cream → [0.2, 0.95] These
are far apart. Therefore: Pizza ≠ Ice cream
Vector embeddings convert words and sentences into positions in vector
space where same meaning words/sentences are placed closer to each other
in Embedding space.
How emdeddings/floats are calculated / How embedding model is trained?
Embeddings are found during traning of neural network.
Weights, bias(gradient desent) & backpropagation are adjusted to similar
words together and make dissimilar words apart
Weights, biases are adjusted millions of times in Neural network
Contrastive Training
Contrastive training teaches a model by showing it groups of items: a
matching pair (positive pair) and a mismatching pair (negative pair)
Positive Pair: Two items that mean the same thing or belong together
Negative Pair: One item paired with a completely unrelated item
The Goal: Loss function measures the distance between the vectors. Model
is rewarded when positive pairs end up closer and model is punished when
negative pairs are closer or positive pairs are far apart.
(Puppy, Dog) = Positive Pair
(Puppy, Car) = Negative Pair

How Training happens?
- Untrained model sprays words randomly across the map.
- Puppy is placed at(1, 5), Dog(8, 2), Car(2, 5)
- Distance between "Puppy" and "Dog" is large (the model gets a penalty)
- Model tweaks its internal weights to pull "Puppy" and "Dog" closer to each other
Embedding Space
Embedding space = the mathematical space containing all those
points/vectors
if we plot above embeddings on graph, it is called embedding space.
Real embedding spaces may have
2Billion or more dimensions
Ollama's embedding model(nomic-embed-text) has 768 dimension. Hence
every word is represented by array of 768 floats
But 768 or more dimensions of a word is very tough visualize
PCA (Principal Component Analysis) is the technique to reduce
dimensionailty of embedding to 2.
              Sweetness
                 ↑
                 |
          Ice cream ●
                 |
                 |
                 |
                 |
 Salad ●         |        ● Pizza
                 |             ● Burger
                 +------------------------→ Fast-food-ness
Static Embedding
A word appears in different contexts have different meaning. Eg:
I deposited money in the bank.
I sat on the bank of the river.
Word bank appears in different context(should have different embedding
value), but model assign it fixed vector
bank → [0.42, -0.17, 0.83, ...]
fixed vector
Solution: Contextual embeddings
Allow a word to be represented by multiple embeddings that incorporate information about the surrounding words
Embdedding models are used in RAG pipelines. They take unstructured data(eg: text) and breaks into vectors/tensors
Encoding
Encoding means converting Categorical Data or
other data to numerical vectors that a model can train on.
This conversion is necessary because models can only train on
floating-point values; models can't train on strings such as "dog" or
"maple".
One Hot Encoding
If feature have strings the converting string to bits to represent the encoding.
Feature	  Red	  Orange	Blue	Yellow	Green	Black	Purple	Brown
"Red"	      1	  0	      0	    0	      0	    0	    0	      0
"Orange"	  0	  1	      0	    0	      0	    0	    0	      0
"Blue"	    0   0	      1	    0	      0     0     0       0
"Yellow"	  0   0	      0	    1	      0     0     0       0
"Green"	    0   0	      0	    0	      1     0     0       0
"Black"	    0   0	      0	    0	      0     1     0       0
"Purple"	  0   0	      0	    0	      0     0     1       0
"Brown"	    0   0	      0	    0	      0     0     0       1
Fairness
This is effort to detect, measure, and correct the
biases so that algorithms treat all individuals
equitably.
Types of fairness
1. Demographic Parity
Demographic parity requires that a model's positive decisions (like
approving a loan) are made at equal rates across all groups, regardless
of historical qualifications or repayment rates.
Simple Example: Out of 100 applicants from Group A, the AI
approves 50 (50%). Demographic parity demands that out of 100 applicants
from Group B, the AI also approves 50 (50%), even if Group B submitted
fewer complete applications overall.
The Catch: It focuses purely on equal outcomes, ignoring whether
applicants actually qualify, which can sometimes force unfair shortcuts.
2. Equality of Opportunity
Equality of opportunity requires that qualified individuals from all
groups have an equal chance of being accepted. It focuses only on the
subset of people who deserve or are qualified for the positive outcome
(the "true positives").
Simple Example: Imagine 40 people in Group A and 40 people in
Group B are fully qualified to repay a loan. Equality of opportunity
means the AI must approve loans for 36 qualified people in Group A (90%)
and 36 qualified people in Group B (90%).
The Catch: It allows different overall approval rates between
groups as long as the qualified individuals within those groups are
treated equally.
3. Counterfactual Fairness
Counterfactual fairness looks at an individual level rather than group
statistics. A decision is counterfactually fair if it would have been
exactly the same if the person's sensitive attribute (like race or
gender) had been magically flipped to something else, while all other
facts remained unchanged.
Simple Example: A woman applies for a loan with a specific
income, credit score, and debt history, and she gets rejected. To test
for counterfactual fairness, you run her exact profile through the AI
model again, changing only her gender to male. If the model now approves
the loan, it violates counterfactual fairness because the decision was
explicitly sensitive to her gender.
Feature
Features are the values that a supervised model uses to predict the label.
Feature Cross
Take Cartesian product of 2 or more categorical features of the dataset.
Apples : {Red, Green}
State: {Ripe, Raw}
Feature Cross: Red_Ripe, Red_Raw, Green_Ripe, Green_Raw
Feature Engineering
Changing raw dataset values(features) to some values with which model
can be trained better is called feature engineering.
Methods of Feature Engineering:
1. Normalization: Converting numerical values into a standard range
2. Binning (also referred to as bucketing): Converting numerical values
into buckets of ranges.
1. Normalization
The goal of normalization is to transform features to be on a similar
scale.
Example
Feature X spans the range 154 to 24,917,482.
Feature Y spans the range 5 to 22.
These two features span very different ranges. Normalization
might manipulate/change X and Y so that they span a similar range
Benefits of Normalization
1. Helps models converge more quickly during training. When different
features have different ranges, gradient descent can "bounce" and slow
convergence.
2. Helps models make better predictions.
3. Helps avoid the "NaN trap" when feature values are very high. NaN is
an abbreviation for not a number.
4. Helps the model learn appropriate weights for each feature.
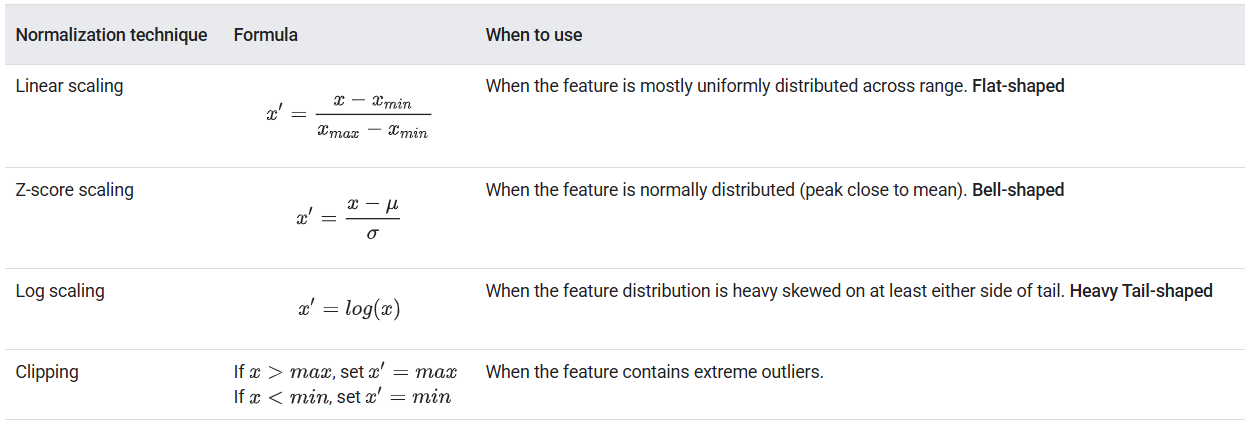
Methods of Normalization
1. Linear Scaling/Scaling: Converting floating-point values from
their natural range into a standard range—usually 0 to 1 or -1 to +1.
2. Z-score scaling: Number of standard deviations a value is from
the mean. For example, a value that is 2 standard deviations greater
than the mean has a Z-score of +2.0
3. Log Scaling: Log scaling computes the logarithm of the raw
value. In theory, the logarithm could be any base; in practice, log
scaling usually calculates the natural logarithm (ln).
4. Clipping: Technique to minimize the influence of extreme
outliers. In brief, clipping usually caps (reduces) the value of
outliers to a specific maximum value
5. Binning/Bucketing: Grouping different numerical subranges into
bins. For example, consider a feature named X whose lowest value is 15
and highest value is 425. Using binning, you could represent X with the
following five bins:
Bin number	Range   	Feature vector
1	          15-34	    [1.0, 0.0, 0.0, 0.0, 0.0]
2	          35-117	  [0.0, 1.0, 0.0, 0.0, 0.0]
3	          118-279	  [0.0, 0.0, 1.0, 0.0, 0.0]
4	          280-392	  [0.0, 0.0, 0.0, 1.0, 0.0]
5	          393-425	  [0.0, 0.0, 0.0, 0.0, 1.0]
6. Quantile Bucketing: creates bucketing boundaries such that the number of examples in each bucket is exactly or nearly equal
Fitting
Overfitting
Means that the model performs well on the training data, but it does not
generalize well(ie produces good results on real world/unseen data),
This is because model memorizes the exact relationship in the sample
data including noise or minor details.
Overfitting Example on DecisionTreeRegressor
Regularization
Technique used in machine learning to prevent overfitting by adding a penalty for complexity. It discourages the model from memorizing noise or random patterns in the training data
| Type | Meaning |
|---|---|
| L2 Regularization (Ridge) | Adds a penalty proportional to the square of the model's weights. It shrinks all weights evenly without making them zero, making the model more stable |
| L1 Regularization (Lasso) | Adds a penalty proportional to the absolute value of the weights |
| Dropout | Randomly turns off a set of neurons during training in neural networks. This stops neurons from depending too much on each other |
| Early Stopping | Stops the training process as soon as performance on a validation dataset stops improving |
Generalization
Generalization is the opposite of overfitting. That is, a model that generalizes well makes good predictions on new data and on training data both.
Underfitting
Does not produces good results on traning data and bad results on new
data as well
Underfitting Example on DecisionTreeRegressor
Hallucination
A response from an LLM that contains false, fabricated, or misleading
information presented as absolute fact
How to reduce Hallucinations?
1. Use information available in RGA documents to validate the output.
Inference / Prediction
Once we're satisfied with the results from evaluating the model (ie training is done), we can use the model to make predictions, called inferences, on unlabeled examples.
Offline inference
Rather than responding to queries at serving time, the trained model makes predictions in advance and then caches those predictions.
Label
The label is the "answer," or the value we want the model to predict.
Types of Labels
1. Direct labels: Labels identical to the prediction your model is
trying to make as present in labels coloumn in dataset
2. Proxy labels: which are labels that are similar—but not identical—to
the prediction your model is trying to make.
Language Models
A model is a software that learns the patterns of language and can predict the next token/word from previous words/tokens. Eg:
"I am going to ___"
A language model might predict:

school   → 0.40
office   → 0.25
home     → 0.15
market   → 0.05
...
1. n-gram language model
An N-gram is just a group of N consecutive words.
| 2-gram (bigram) | 3-gram | |
|---|---|---|
| Meaning |
Does prediction using 2 words |
Does prediction using 3 words |
N-gram have Context problem?
| 3-gram | n-gram |
|---|---|
A 3-gram will only look at 2 words around the word for prediction.
Eg: |
But can't we take n=1000 for better prediction? The larger the N, the rarer the exact sequence become. "I like machine learning" might appear thousands of times. Does not generalize well |
2. Large language Model / Model
LLMs predict a Token or sequence of tokens, LLMs
contain far more parameters than recurrent models.
Examples:
- Opensource Models: Llama, Gemma, Phi, Llama 3.2, Qwen 2.5 3B
- Closedsource Models: gpt(openai), Claude (Anthropic).
Challenges with LLMs:
Gathering an enormous training set.
Consuming multiple months and enormous computational resources
and electricity.
Solving parallelism challenges.
Have hallucinations.
- Llama(Meta's LLM) Models
| Llama 2 (Released on Jun,2023) | Llama 3 (Released on Apr,2024) | |
|---|---|---|
| Trained Model sizes | 7, 13, and 70 billion parameters | 8B and 70B parameters |
| Improvments | fine-tuned for dialog wrt Llama-1 | 400B+ parameters is currently being trained |
2.1 Transformer LLM
A LLM has n number
Neural Networks. Each Neural Network is created using k number of
Neurons
Each Neuron has m
weights and biases. A Transformer LLM have
trillions of weights and biases
It is used in wide variety of language model applications, such as
translation eg: English to French
Transformer consists of:
1. Encoder(Huge Neural Network): converts input text into an
intermediate representation.
2. Decoder(Huge Neural Network): converts that intermediate
representation into useful text

How Transformer LLM Works
Work of every LLM is to predict next token based on previous/surrounding
token.
Consider this example
The brown dog sat next to the red fox. Step-1: Prompt is split into tokens, each token is converted to vector/embedding representation
"First Guess embedding/vector"
the		[0.10,0.21,0.05,0.12,0.07]
brown	..
dog		..
sat		..
next	..
to		..
the		..
red		..
fox		..
Step-2: Each token also also provided a positional vector that where its located in prompt?
"Position embedding/vector"
the		[0.54,0.19,0.12,0.32,0.45]
brown	..
dog		..
sat		..
next	..
to		..
the		..
red		..
fox		..
Step-3(Attention):
Each token can see position/meaning/vector embedding
of every other token in the prompt.
Each token then decided which other Token it should pay most
attention to.
In above sentence, Word "Dog" will provide most attention to
"brown" and "sat". Since those words directly relate to thed Dog
70% attention is assigned to brown. 20% to sat and 10% to all
other tokens
The brown dog sat next to the red fox.
    |-----|----|
    70%       20%
Attention Heads:
Most transformer models generate this attention via Layers
called(Attention Heads). Smaller models may have 8-16 attention heads,
while larger have 100 or more
There can be several attention heads in Transformer LLM. Eg: 1.
Head-1: Specializes in relationships between objects and their
descriptions
2. Head-2: Specializes in Spatial relationships between objects.
Step 4(Feed Forward Phase): This is biggest phase of LLM, ie it
contains majority of parameters
- Based on "Position embedding/vector", "First Guess embedding/vector"
and "Attention" each token is assigned a new embedding vector.
- These new embeddings are formed by context of other tokens in the
prompt
Step 5(Repeat):
Most LLMs repeat Step 1-4 N times(8-64 times). ie after N gusses
embeddings for words in prompt is generated.
                                     \/-----------------------------------------------------------------------------|
           |-----------|     |----------------|     |----------------|                                              |
           |           |     |  Token         |     | Postition      |     |-----------|     |--------------|       |
Prompt --> | Tokenized | --> | Emmbedding LLM | --> | Embedding LLM  | --> | Attention | --> | Feed Forward | --> Updated
           |-----------|     |----------------|     |----------------|     |-----------|     |--------------|    Token Embeddings
                              embedding of each      Positiional embedding
                              token in calculated    for tokens calculated
Step 6(Decode):
LLM asks based on updated embeddings of tokens, what token should come
next?
This is calculated as probability distribution of all tokens in Model's
Dictionary
Token      Probability
        and         32%
        in          25%
        on          18%
        that        12%
        with         9%
        who          7%
Step 7(Pick the Token)
Finally LLM picks best probability token from the distribution and token
is appended to the end of the prompt. And after all this work 1 token is
gussed
If we want to generate the 2nd token, Model will repeat all this process
from scratch, until next token is generated or token limit is
reached.
Finally it generates EOS(End of Sentence) token
signifying generation is ended.
The brown dog sat next to the red fox and
                                      /\
Step 7.1 Ways to Pick Next Token:
Token has to be picked in Step-7. There can be several ways to pick the
next token
1. Greedy Decoding: Pick token with highest probability(as done
above).
- Used in: Code completion, debugging
- Disadvantages: Predictable/deterministic output. Same sounded text
2. Top-K Sampling: pick a token from top k probablity tokens
3. Top-P Sampling: Choosing a token after some x probality
threashold, ie discarding the high probability tokens
4. Repetition Penalty: Penalizing the model for generating
repetative token/text
5. Logit Biases:
Fine Tuning
Additional training of foundational LLM model to learn specific tasks.
Distillation
The distilled LLM generates predictions much faster and requires fewer computational and environmental resources than the full LLM
LLM Model's Efficiency
1. Parameters:
The "1B", "3B", or "8B" stands for Billion Parameters(the number of
internal connections inside the AI's brain). More parameters usually
mean a smarter model, but it requires more memory.
2. Quantization: Floating point numbers for
weights/calculations.
3. Speed (Tokens per Second): Tokens are fractions of words (100
tokens $\approx$ 75 words).An efficient model running on a good GPU will
hit 40 to 100+ tokens per second, printing text faster than you can read
it. If it drops below 10-15 tokens/sec, it feels sluggish.
4. Resource Utilization(Fitting in VRAM): Does the model fit
entirely inside your Graphics Card's memory (VRAM)? If it fits in VRAM,
it runs at lightning speed. If it overflows into your system RAM,
performance drops off a cliff.
Layer / class or Function
Layer processes input data(tensor) and produces an output(tensor) in
specific format.
Neural network is created by cascading
multiple layers.
Types of Layers:
| Dense Layer / Fully connected layer | Convolutional Layer | Recurrent Layer | |
|---|---|---|---|
| What | Each neuron is connected to every neuron in the previous layer. | Use convolutional operations to detect local patterns in the input data. | Processes sequential data, where the order of the input matters |
| Usage | image classification, regression, and more | image classification, object detection, image segmentation, spatial hierarchies | natural language processing (NLP), time series analysis, and speech recognition |
E. Generative AI
Class of models that creates content from user input. For example,
generative AI can create unique images, music etc
Example:
Text-to-text
Text-to-image
Text-to-video
Text-to-code
Text-to-speech
Image and text-to-image
Loss
Loss is a numerical metric that describes how wrong a model's
predictions are. Loss measures the distance between the model's
predictions and the actual labels.
Loss focuses on the distance between the values, not the direction. For
example, if a model predicts 2, but the actual value is 5, we don't care
that the loss is negative (2 – 5= –3). Instead, we care that the
distance between the values is 3.
Losses in Linear Regression
1. MAE(Mean Absolute Error)
2. MSE(Mean Squared Error)
3. RMSE(Root Mean Squared Error)
4. L2 Loss
Loss metrics like MAE and RMSE may be preferable to L2 loss or MSE in
some use cases because they tend to be more human-interpretable.
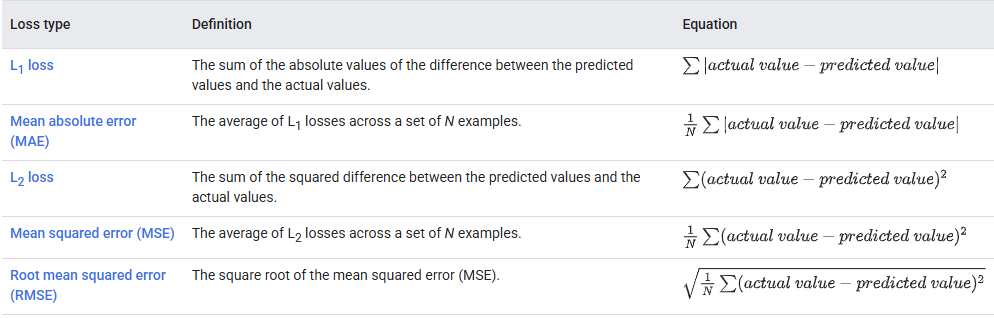
MSE moves the model more toward the outliers, which is not correct. Now Model is treating outliers as correct values. MAE does not.
Loss Curve & Convergence
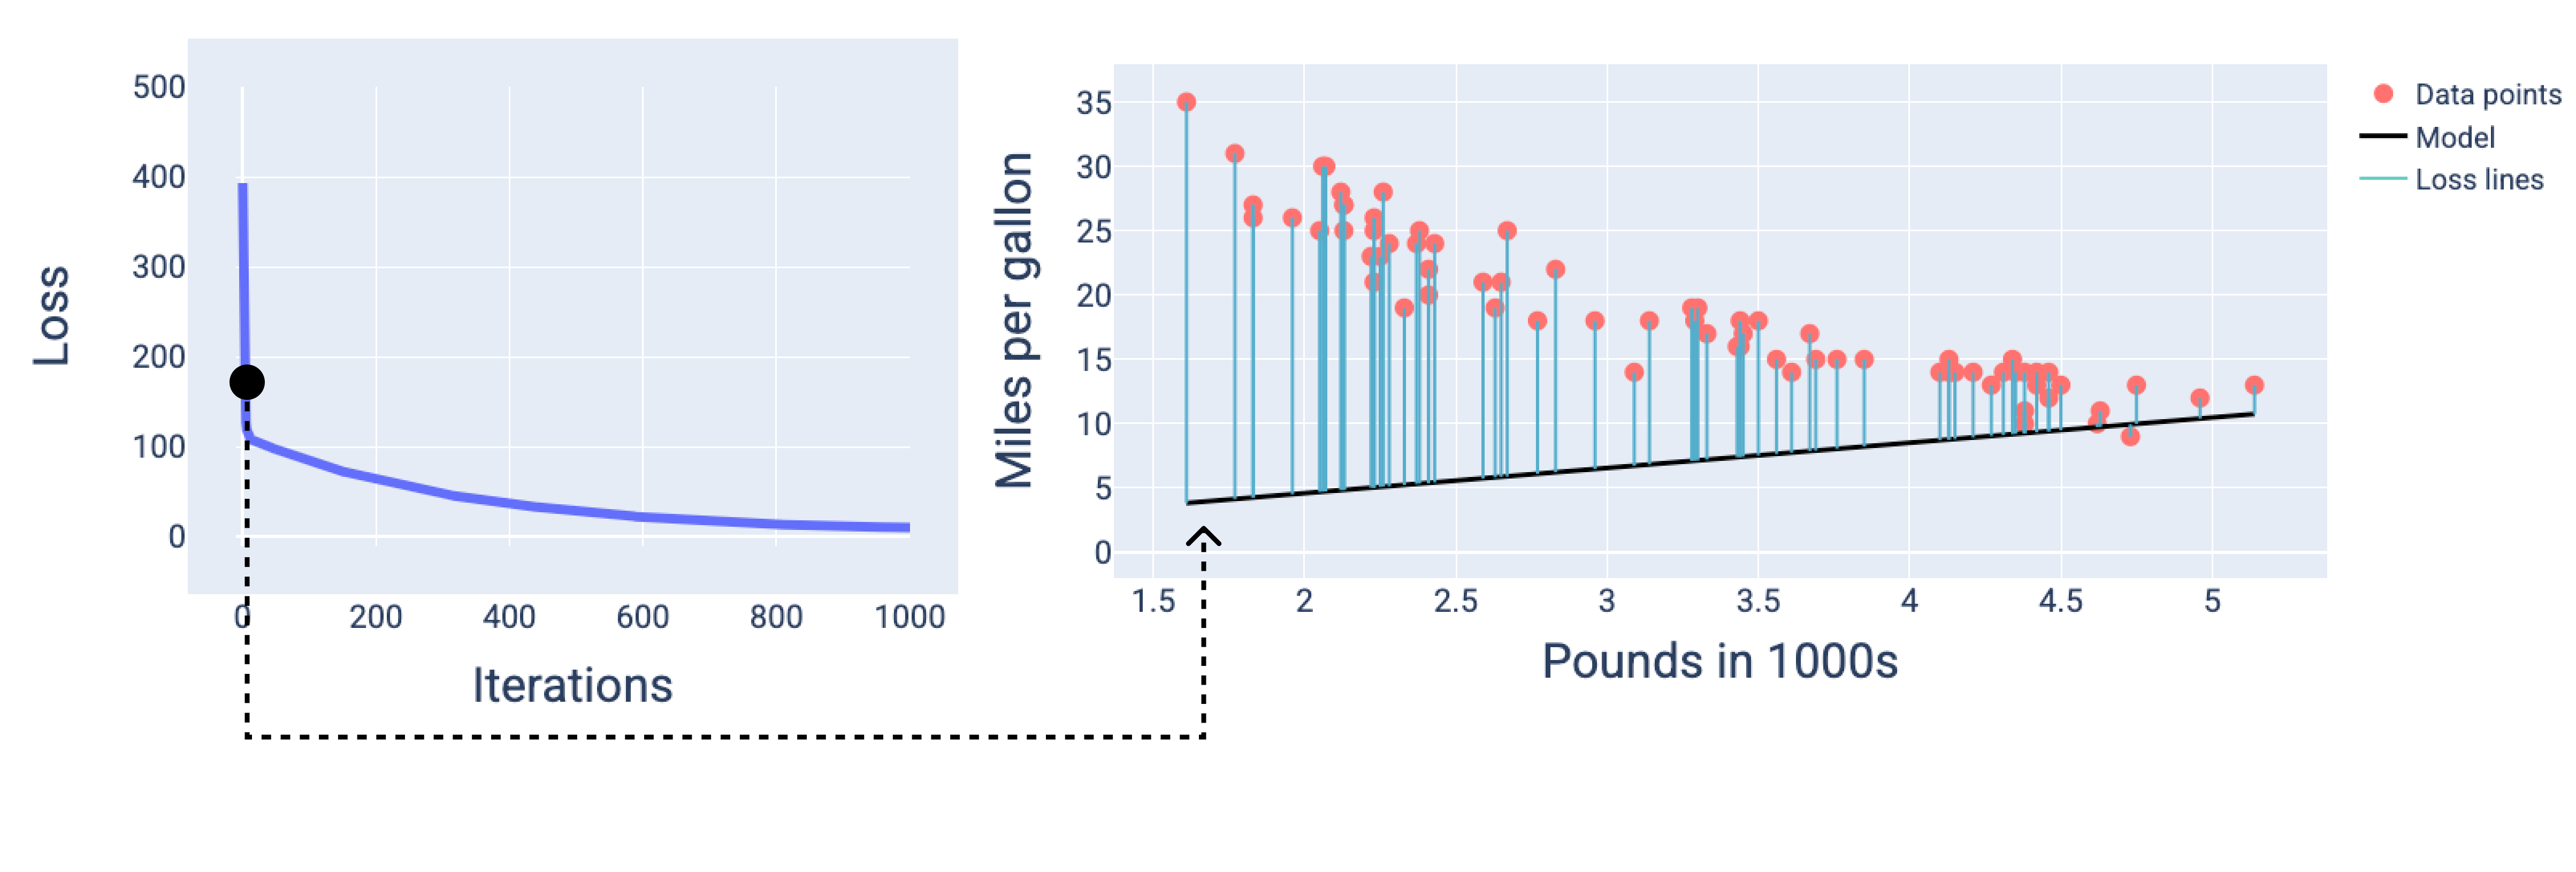
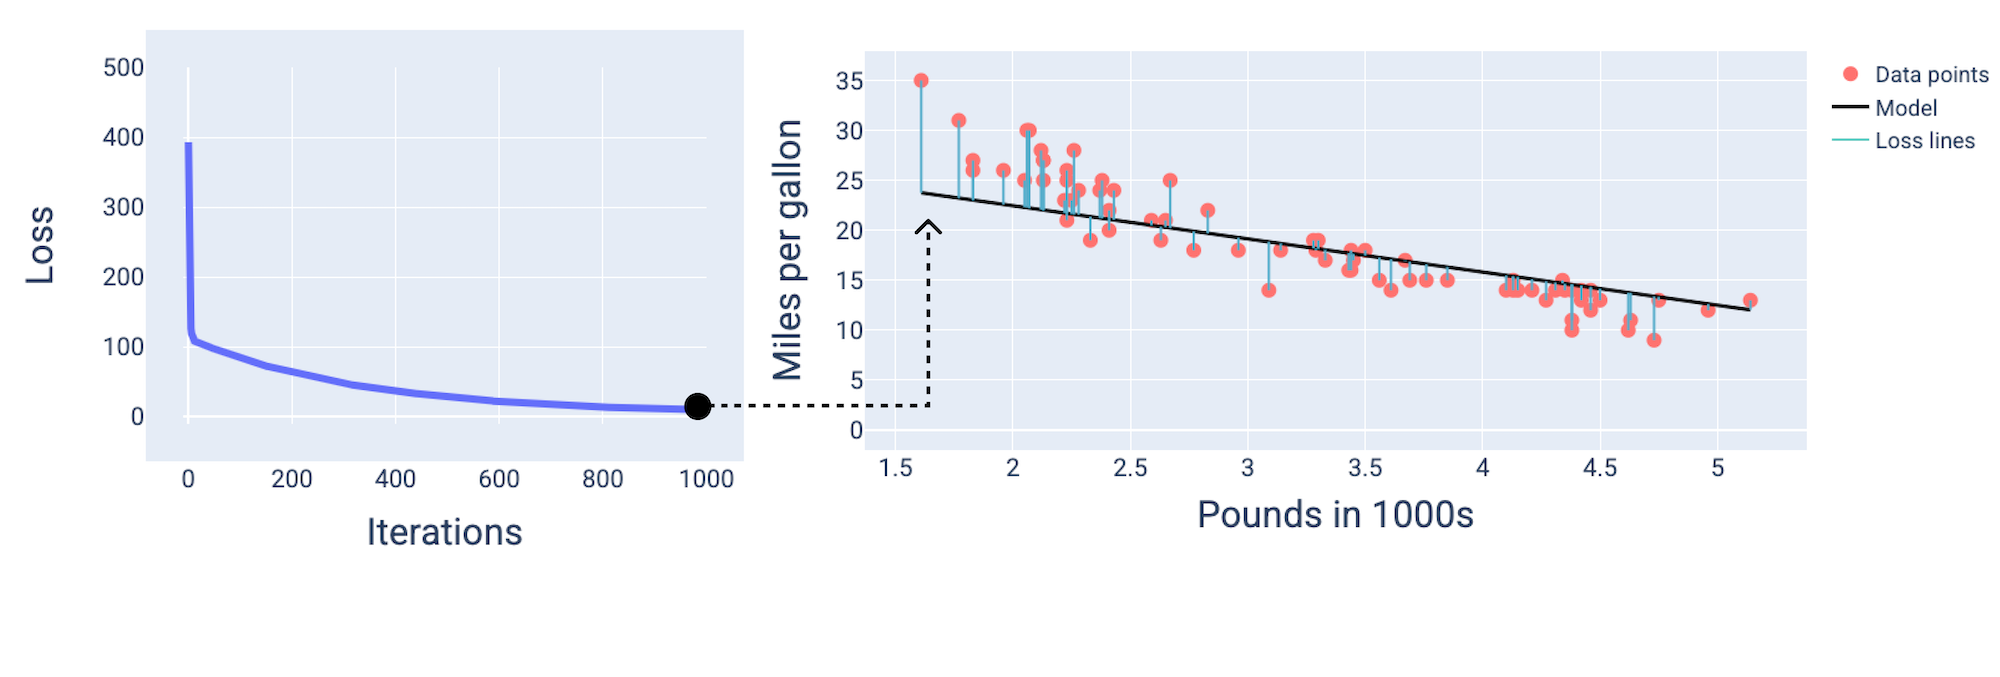
When training a model, you'll often look at a loss curve to determine if
the model has converged. The loss curve shows how the loss changes as
the model trains. The following is what a typical loss curve looks like.
Loss is on the y-axis and iterations are on the x-axis
Loss curve showing the model converging around the 1,000th-iteration
mark.
|
|
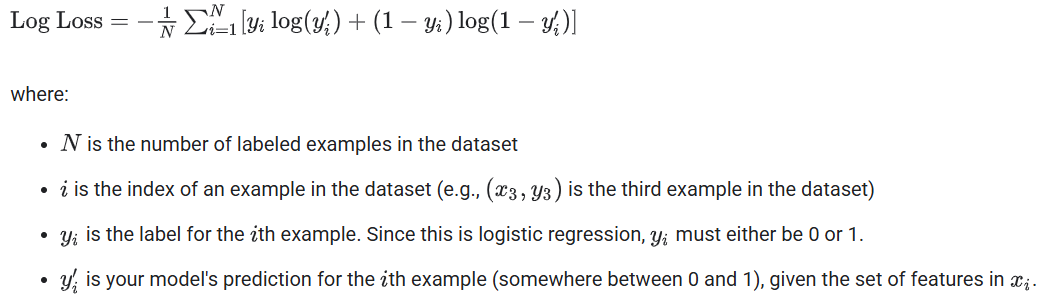
Loss in Logistic Regression is Log Loss
Loss for Keras
binary_crossentropy: Binary Classification (2 classes, e.g., Spam
vs. Not Spam)
categorical_crossentropy: Multi-Class Classification (3+ mutually
exclusive classes)
mean_squared_error, mean_absolute_error: Regression (Predicting
continuous numbers)
Matplotlib
Popular plotting library for Python that provides a variety of
high-quality 2D and 3D plots and visualizations.
Matplotlib.pyplot is a collection of functions that make
Matplotlib work like MATLAB, allowing you to create plots, charts
imshow(digit, cmap=plt.cm.binary) is used to display images in
digit array, cmap=colormap for mapping the data values to colors in the
plot. plt.cm.binary = black and white colors.
Metrics
Metrics to monitor during training and testing
One neuron = one linear equation
Linear equation
in Hyperplane is called a neuron
y = m1x1 + m2x2 + m3x3 + b // 3 features, 1 label = Neuron
z = m1x1 + m2x2 + m3x3 + m4x4 + m5x5 + b // 5 features, 1 label=Neuron
class Neuron:
    def __init__(self, num_inputs):
        self.weights = initialize_weights(num_inputs)
        self.bias = initialize_bias()
        self.activation_function = relu

    def forward(self, input_data):
        # Compute the weighted sum of inputs
        weighted_sum = sum(weight * input_value for weight, input_value in zip(self.weights, input_data)) + self.bias

        # Apply the activation function
        output = self.activation_function(weighted_sum)

        return output
Neural Network
This is brain-inspired AI model which uses interconnected nodes
neurons in layers to finds patterns in input data,
then learn from examples to make predictions
It contains an input layer, one or more hidden layers, and an output
layer.
Creating Neural Network using Keras
|-------------|                                  |-------------|
|             |         |--------------|         |             |
| Input Layer |-------->| Hidden Layer|--------->| Output Layer|
|             |         |--------------|         |             |
|-------------|                                  |-------------|
Prompt?
Prompts are the sequence of tokens fed into the model
But when we chat with systems like ChatGPT we are actually exchanging
messages. Behind the scenes, these messages are concatenated and
formatted into a prompt that the model can understand.

Prompt Types
| Type | Meaning | Template |
|---|---|---|
| System Prompts |
Define how the model should behave. They serve as persistent
instructions, guiding every subsequent interaction. Below is converstation between user and model. The system prompt is hidden from the user, User want help on his order. |
|
Prompt Engineering
PE helps LLM users to customize the model's output. That is, end users clarify how the LLM should respond to their prompt.
One Shot Prompting
Showing 1 example to an LLM and LLM starts providing similar output
peach: drupe
apple: ______
Few Shot Prompting
Providing multiple examples
Zero Shot prompting
providing no example to LLM, but LLM likes context for predictions
Planes
2 D Plane
Only 2 axis x and y
3 D Plane
Linear equation in 2 D Plane
y = mx + nz + b
Hyperplane(N Dimensional Plane)
Feature, Label
Linear equation in Hyperplane
          y = m1x1 + m2x2 +
          m3x3 + b // 3 features, 1 label


          z = m1x1 + m2x2 +
          m3x3 + m4x4 +
          m5x5 + b // 5 features, 1 label
Temperature
Parameter that controls the randomness of prediction of
LLM
Temp=1 leads to original distritution
Temp=.5 leads to more spiky distribution
Temp=0 makes Greedy Decoding
Example Code
Tensor = n-D Matrix
This is matrix(as in maths). Multi-dimensional numpy arrays used to store numbers during computation.
vector? This is 1-D matrix(ie array).
Types of Tensors
| Dimension/Rank /Axis/Ndim |
Name | Representation | Examples |
Shape(Rows,cols) Represents Number of elements in each direction |
Processed By (Keras) |
|---|---|---|---|---|---|
| 0 | Scalar | [0] | (0) | ||
| 1 | vector | [1,2,3,4] | (4) //Since 4 elements in 1 direction |
||
| 2 | Matrix / 2D Tensor |
|
samples | (2,3) //Since 2 elements in 1 direction & 3 in other |
Dense Layer |
| 3 | 3D Tensor |
|
Timestamped data | (2,2,3) | Recurrent layers(eg: LSTM layer) |
| 4 | 4D Tensor | 3D tensors packed together | 2D convolution layers (Conv2D) |
            import numpy as np
            ########## 2-D Tensor ###########
            b = np.array(
                [
                    [0, 1, 2, 3],
                    [4, 5, 6, 7],
                    [8, 9, 10, 11],
                ]
            )
            print("Dimension/Ndim:", b.ndim)        # 2         //2d array
            print("Shape:", b.shape)                # (3, 4)    //(row,col)

            ########## 3-D Tensor, Packing 2-D matrices ###########
            c = np.array(
                [
                    [
                        [0, 1, 2],
                        [4, 5, 6],
                        [8, 9, 10],
                    ],
                    [
                        [10, 11, 12],
                        [14, 15, 16],
                        [18, 19, 110],
                    ]
                ]
            )
            print("Dimension/Ndim:", c.ndim)    # 3         //3d array
            print("Shape:", c.shape)            # (2,3,3)   //(2=arrays, 3=row, 3=col)

            ####### Operations ############
                #all,row,col
            d = c[:, 2:, 2:]            # Select all elements 2nd(row), 2nd(col) onwards.
            print(d)                    #   [[[ 10]]  [[110]]]
Tensor Operations
Add vector(dimension=1) + matrix(dimension=2)
|1 2 3| + | 1 2 3 | = |2 4 6|
          | 4 5 6 |   |5 7 9|

import numpy as np
def naive_add_matrix_and_vector(x, y):
    assert len(x.shape) == 2    #Matrix
    assert len(y.shape) == 1    #vector
    assert x.shape[1] == y.shape[0]

    x = x.copy()
    for i in range(x.shape[0]):
        for j in range(x.shape[1]):
            x[i, j] += y[j]
    return x

x = np.array(
        [
            [1,2,3],
            [4,5,6]
        ]
)
y = np.array([1,2,3])
z = naive_add_matrix_and_vector(x,y)
print(z)
'''
[[2,4,6]
[5,7,9]]
'''
Dot Product (.)
| 2 Vectors = Scalar | Vectors(1D).Matrix(2D) = vector |
|
|
Tensor Reshaping
- Shape(3,2) to (6,1). (2,3)
>>> x = np.array([[0, 1],
                  [2, 3],
                  [4, 5]])
>>> print(x.shape)      #See above how shape(3,2)
(3, 2)
>>> x = x.reshape((6, 1))
>>> x
array([[ 0],
       [ 1],
       [ 2],
       [ 3],
       [ 4],
       [ 5]])
>>> x = x.reshape((2, 3))
>>> x
array([[ 0, 1, 2],
       [ 3, 4, 5]])
- Transpose
>>> x = np.zeros((300, 20))
>>> x = np.transpose(x)
>>> print(x.shape)
(20, 300)
Tensor Terms
| Term | Mearning |
|---|---|
| Data types(dtype) |
Data type of data present in tensor. Eg: float32, uint8, float64 String tensors don’t exist in Numpy (or in most other libraries), because tensors are preallocated contiguous memory segments, and strings, being variable length |
| Axis/ndim/Rank/Dimension |
Dimension of matrix
Dimension/Axis   Array
    0           np.array(12)                     // Point does not have any dimension
    1           np.array([1,2])                     // 1x2. 1 Dimensional
    2           np.array([[5, 78, 2, 34, 0],       // 3x4. 2 Dimensional
                        [6, 79, 3, 35, 1],
                        [7, 80, 4, 36, 2]])
|
| Shape |
Tells how many size tensor has along each axis previous matrix example has shape (3, 5), and the 3D tensor example has shape (3, 3, 5) |
Token
The underlying principle of an LLM is to predict the next token, given a
sequence of previous tokens.
A “token” is the unit of information an LLM works with. You can think of
a “token” as if it was a “word”
Each model Iterates in prediction loop until it reaches EOS(End of
Sentence) token or max token limit.
Every LLM breaks word/sentence into different token sizes
How are you doing?
GPT = 5 token, 18 characters (How, are, you, doing, ?)
Claude = 5 token, 18 characters (How, are, you, doing, ?)
LLama 2 = 6 token, 18 characters (<s>, How, are, you, doing, ?)

Model	      Provider	     EOS Token	          Functionality
GPT4	      OpenAI	      <|endoftext|>	        End of message text
Llama 3	    Meta        	<|eot_id|>	          End of sequence
Deepseek-R1	DeepSeek	    <|end_of_sentence|>	  End of message text
SmolLM2	    Hugging Face	<|im_end|>	          End of instruction or message
Gemma	      Google	      <end_of_turn>	        End of conversation turn
Conversations: User and Assistant Messages
A conversation consists of alternating messages between a Human (user)
and an LLM (assistant).
Chat templates help maintain context by preserving conversation history,
storing previous exchanges between the user and the assistant. This
leads to more coherent multi-turn conversations.
Tools
Tool is a function given to the LLM. For instance, if you ask an LLM
directly (without a search tool) for today’s weather, the LLM will
potentially hallucinate random weather.
Some commonly used tools in AI agents
| Tool | Functionality |
|---|---|
| Calculator | Perform mathematical calculations |
| Web Browser | Searches the web for information |
| Code Interpreter | Executes code snippets and returns results |
| Image Generation | Creates images based on text descriptions. |
Example of Tool
|
Tool Call from frontend |
Training
Before a model can make predictions, it must be trained. To train a
model, we give the model a dataset with labeled
examples. The model's goal is to work out the best solution for
predicting the labels from the features.
The model finds the best solution by comparing its predicted value to
the label's actual value. Based on the difference between the predicted
and actual values—defined as the loss—the model gradually updates its
solution
In other words, the model learns the mathematical relationship between
the features and the
Label so that it can make the best predictions on
unseen data.
Variance
-
Variance is the tendency to learn random things unrelated to the real
signal